Tesla's net income/loss from FY 2014 to FY 2023 (in million U.S. dollars)
Loading statistic...
Basic Account
Get to know the platform
You only have access to basic statistics.
Starter Account
The ideal entry-level account for individual users
- Instant access to 1m statistics
- Download in XLS, PDF & PNG format
- Detailed references
$199 USD / Month *
Professional Account
Full access
Business Solutions including all features.
* Prices do not include sales tax.
Other statistics that may interest you Tesla
Overview
6
- Premium Statistic Most valuable automotive brands worldwide by brand value 2023
- Basic Statistic Plug-in electric light vehicle sales worldwide 2015-2022
- Premium Statistic Tesla's vehicle production by quarter Q1 2024
- Basic Statistic Tesla's vehicle sales by quarter YTD Q1 2024
- Premium Statistic Electric vehicle sales globally by model 2023
- Premium Statistic Range of selected electric vehicle models 2023
Financials
7
- Basic Statistic Tesla's revenue 2008-2023
- Basic Statistic 
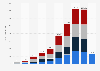
Tesla's net income 2014-2023
- Premium Statistic Tesla's R&D spending 2010-2023
- Premium Statistic Tesla - SG&A expenditures 2008-2023
- Premium Statistic Tesla's free cash flow by quarter 2019-2023
- Premium Statistic Tesla's operating margin by quarter 2019-2023
- Premium Statistic Tesla's market capitalization 2023
Segments
5
- Premium Statistic Tesla's revenue by segment 2023
- Premium Statistic Tesla's gross margin by segment 2021-2023
- Premium Statistic Tesla's domestic and international revenue 2018-2023
- Premium Statistic Tesla: vehicle deliveries by main model and quarter 2024
- Premium Statistic Quarterly Tesla supercharger station and connector volume worldwide 2020-2023
Environmental impact
8
- Premium Statistic Average lifecycle emissions of Tesla Model 3/Y by selected countries and regions 2022
- Premium Statistic Volume of raw materials recovered by Tesla for recycling 2021-2022
- Premium Statistic Tesla's scope 1 emissions in 2021-2022, by sector
- Premium Statistic Scope 2 emissions of Tesla by sector 2021-2022
- Premium Statistic Scope 3 emissions of Tesla by category in 2022
- Premium Statistic Waste diverted from disposal by Tesla in global manufacturing by category 2021-2022
- Premium Statistic Waste diverted to disposal by Tesla in global manufacturing by category 2021-2022
- Premium Statistic Tesla's total freshwater withdrawal for manufacturing 2020-2022
Competitors
8
- Premium Statistic Plug-in electric vehicle sales worldwide by brand 2023
- Premium Statistic Plug-in electric vehicle market share by manufacturer 2023
- Premium Statistic BYD Group: revenue 2010-2023
- Premium Statistic BYD Group's total vehicle sales 2019-2022, by type
- Basic Statistic Volkswagen Group's sales revenue 2006-2023
- Premium Statistic Volkswagen Group BEV deliveries by brand 2022-2023
- Basic Statistic General Motors Company: revenue 2013-2023
- Premium Statistic Chevy Bolt EV sales in the United States 2017-2023
Special focus on domestic market
4
- Premium Statistic Automotive manufacturers' estimated market share in the U.S. 2023
- Premium Statistic Tesla: Monthly U.S. market share 2023
- Premium Statistic Best-selling battery-electric cars in the United States 2023
- Premium Statistic Number of electric vehicle fast charging stations in the U.S. by connector 2024
Further related statistics
13
- La Banque Postale: contribution of business lines to net banking income 2018
- Media perception of Tesla in the Netherlands 2020, by characteristic
- Latin America: most profitable banks in 2019, by profit value
- Pandora's net income/loss 2007-2017
- Sporting goods industry: Net income of Cybex 2011
- Joy Global's net income 2007-2016
- AGCO's net income 2012-2022
- Texas Instruments net income 2008-2023, by quarter
- Net (loss) income per common share of Mattel toy manufacturer 2006-2018
- Leading forest, paper and packaging companies: global net income 2006-2015
- The Face Shop's net income 2014-2019
- Bumble: annual net income 2018-2023
- EVs: global projected electric powertrain production share 2011-2020
Further Content: You might find this interesting as well
Statistics
- La Banque Postale: contribution of business lines to net banking income 2018
- Media perception of Tesla in the Netherlands 2020, by characteristic
- Latin America: most profitable banks in 2019, by profit value
- Pandora's net income/loss 2007-2017
- Sporting goods industry: Net income of Cybex 2011
- Joy Global's net income 2007-2016
- AGCO's net income 2012-2022
- Texas Instruments net income 2008-2023, by quarter
- Net (loss) income per common share of Mattel toy manufacturer 2006-2018
- Leading forest, paper and packaging companies: global net income 2006-2015
- The Face Shop's net income 2014-2019
- Bumble: annual net income 2018-2023
- EVs: global projected electric powertrain production share 2011-2020
Tesla. (January 26, 2024). Tesla's net income/loss from FY 2014 to FY 2023 (in million U.S. dollars) [Graph]. In Statista. Retrieved June 01, 2024, from https://www.statista.com/statistics/272130/net-loss-of-tesla/
Tesla. "Tesla's net income/loss from FY 2014 to FY 2023 (in million U.S. dollars)." Chart. January 26, 2024. Statista. Accessed June 01, 2024. https://www.statista.com/statistics/272130/net-loss-of-tesla/
Tesla. (2024). Tesla's net income/loss from FY 2014 to FY 2023 (in million U.S. dollars). Statista. Statista Inc.. Accessed: June 01, 2024. https://www.statista.com/statistics/272130/net-loss-of-tesla/
Tesla. "Tesla's Net Income/Loss from Fy 2014 to Fy 2023 (in Million U.S. Dollars)." Statista, Statista Inc., 26 Jan 2024, https://www.statista.com/statistics/272130/net-loss-of-tesla/
Tesla, Tesla's net income/loss from FY 2014 to FY 2023 (in million U.S. dollars) Statista, https://www.statista.com/statistics/272130/net-loss-of-tesla/ (last visited June 01, 2024)
Tesla's net income/loss from FY 2014 to FY 2023 (in million U.S. dollars) [Graph], Tesla, January 26, 2024. [Online]. Available: https://www.statista.com/statistics/272130/net-loss-of-tesla/