According to meteorology, weather defines the state of the atmosphere in terms of its perceived temperature (commonly measured in Celsius or Fahrenheit), humidity or aridity, calmness or storminess as well as cloudiness. The observation of the weather is recorded through weather stations scattered all over the world. The short-term observations of these measurements define the weather while the long-term collection of this data defines the climate.
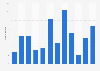
Although the observation of weather and its changes in the seasons have been noted since the bronze age, the record-keeping of weather began with the early enlightenment in Europe in the 17th century. Global temperatures have risen quite dramatically since industrialization in the early 20th century, and is linked to climate change. The Gulf Cooperation Council region is perceived as a hot region, and the United Arab Emirates is also evidently the country with the hottest average temperature at over 32.15 degrees Celsius.
Weather in the Gulf Cooperation Council - statistics & facts
Key insights
- Hottest country worldwide by average temperature
- UAE

Detailed statistics
Average temperature worldwide 2020, by country
- Forecasted leading country with productivity loss due to excessive heat globally in 2030
- Malaysia

Detailed statistics
Global productivity loss due to excessive heat by select country 2030
- MENA country with low weather disaster worldwide
- Qatar

Detailed statistics
Future changes in frequency of decadal temperature extremes 2021
Editor’s Picks Current statistics on this topic
Further recommended statistics
Global weather
9
- Basic Statistic Highest global temperatures recorded
- Premium Statistic Public perception regarding rise in Earth's temperature worldwide 2022
- Premium Statistic Global rainfall anomaly 1901-2021
- Premium Statistic Global economic losses from weather catastrophes 2007-2021
- Basic Statistic Global reported deaths from climate disasters 1970-2019
- Premium Statistic Global disaster risk index 2023, by select country
- Premium Statistic Average temperature worldwide 2020, by country
- Premium Statistic Share of people who think average global temperatures will increase by country 2020
- Premium Statistic Perceived number of hottest years on record, by country 2018
Global weather
-
Basic Statistic
Highest global temperatures recorded

Highest global temperatures recorded
Hottest places measured worldwide (in Celsius)
-
Premium Statistic
Public perception regarding rise in Earth's temperature worldwide 2022

Public perception regarding rise in Earth's temperature worldwide 2022
Public perception regarding how much the Earth has warmed worldwide in 2022
-
Premium Statistic
Global rainfall anomaly 1901-2021

Global rainfall anomaly 1901-2021
Precipitation anomaly worldwide from 1901 to 2021 (in inches)
-
Premium Statistic
Global economic losses from weather catastrophes 2007-2021

Global economic losses from weather catastrophes 2007-2021
Weather catastrophe economic losses worldwide from 2007 to 2021 (in billion U.S. dollars)
-
Basic Statistic
Global reported deaths from climate disasters 1970-2019

Global reported deaths from climate disasters 1970-2019
Number of deaths reported from weather, climate, and water related disasters between 1970 and 2019
-
Premium Statistic
Global disaster risk index 2023, by select country

Global disaster risk index 2023, by select country
Countries with the lowest disaster risk worldwide in 2023
-
Premium Statistic
Average temperature worldwide 2020, by country
Average temperature worldwide 2020, by country
Ranking of the average temperature by country 2020 (in degrees Celsius)
-
Premium Statistic
Share of people who think average global temperatures will increase by country 2020

Share of people who think average global temperatures will increase by country 2020
Share of respondents worldwide who believe average global temperatures will increase in 2020, by country
-
Premium Statistic
Perceived number of hottest years on record, by country 2018

Perceived number of hottest years on record, by country 2018
Perceived number of hottest years on record in 2018, by country
Middle East weather
-
Premium Statistic
Average temperature in MENA 2020, by country

Average temperature in MENA 2020, by country
Ranking of the average temperature in MENA by country 2020 (in degrees Celsius)
-
Premium Statistic
Annual precipitation volume the GCC 2019, by country

Annual precipitation volume the GCC 2019, by country
Annual precipitation volume the Gulf Cooperation Council region in 2019, by country (in million cubic meters)
-
Premium Statistic
Annual precipitation volume in the GCC 2010-2020

Annual precipitation volume in the GCC 2010-2020
Annual volume of precipitation in the Gulf Cooperation Council countries from 2010 to 2020 (in billion cubic meters)
Saudi Arabia
5
- Premium Statistic Monthly minimum temperature at Riyadh KKIA weather station in Saudi Arabia 2019
- Premium Statistic Monthly minimum temperature at Madinah weather station in Saudi Arabia 2019
- Premium Statistic Monthly minimum temperature at Jeddah weather station in Saudi Arabia 2019
- Premium Statistic Monthly maximum temperature at Makkah weather station in Saudi Arabia 2019
- Premium Statistic Annual precipitation volume in Saudi Arabia 2008-2019
Saudi Arabia
-
Premium Statistic
Monthly minimum temperature at Riyadh KKIA weather station in Saudi Arabia 2019

Monthly minimum temperature at Riyadh KKIA weather station in Saudi Arabia 2019
Monthly minimum temperatures at Riyadh KKIA weather station in Saudi-Arabia in 2019 (in degrees Celsius)*
-
Premium Statistic
Monthly minimum temperature at Madinah weather station in Saudi Arabia 2019

Monthly minimum temperature at Madinah weather station in Saudi Arabia 2019
Monthly minimum temperatures at Madinah weather station in Saudi-Arabia in 2019 (in degrees Celsius)
-
Premium Statistic
Monthly minimum temperature at Jeddah weather station in Saudi Arabia 2019

Monthly minimum temperature at Jeddah weather station in Saudi Arabia 2019
Monthly minimum temperatures at Jeddah-KAIA weather station in Saudi-Arabia in 2019 (in degrees Celsius)
-
Premium Statistic
Monthly maximum temperature at Makkah weather station in Saudi Arabia 2019

Monthly maximum temperature at Makkah weather station in Saudi Arabia 2019
Monthly maximum temperatures at Makkah weather station in Saudi-Arabia in 2019 (in degrees Celsius)
-
Premium Statistic
Annual precipitation volume in Saudi Arabia 2008-2019

Annual precipitation volume in Saudi Arabia 2008-2019
Annual volume of precipitation in Saudi Arabia from 2008 to 2019 (in million cubic meters)
United Arab Emirates
13
- Premium Statistic Average annual temperature in the UAE 2013-2021
- Premium Statistic Annual average minimum temperature in the UAE 2013-2021
- Premium Statistic Annual maximum average temperature in the UAE 2013- 2021
- Premium Statistic Annual average number of rainy days in the UAE 2013-2020
- Premium Statistic Annual precipitation volume of the UAE 2008-2019
- Premium Statistic Abu Dhabi's number of rainy days in in the UAE 2005-2020
- Premium Statistic Al-Ain's number of rainy days in the UAE 2005-2020
- Premium Statistic Dubai's number of rainy days in the UAE 2005-2020
- Premium Statistic Sharjah's number of rainy days in the UAE 2005-2020
- Premium Statistic Ajman's number of rainy days in the UAE 2013-2020
- Premium Statistic Umm Al-Quwain's number of rainy days in the UAE 2005-2020
- Premium Statistic Ras Al-Khaimah's number of rainy days in the UAE 2005-2020
- Premium Statistic Fujairah's number of rainy days in the UAE 2005-2020
United Arab Emirates
-
Premium Statistic
Average annual temperature in the UAE 2013-2021

Average annual temperature in the UAE 2013-2021
Average annual temperature in the United Arab Emirates from 2013 to 2021 (in degrees Celsius)
-
Premium Statistic
Annual average minimum temperature in the UAE 2013-2021

Annual average minimum temperature in the UAE 2013-2021
Annual average minimum temperature in the United Arab Emirates from 2013 to 2021 (in degrees Celsius)
-
Premium Statistic
Annual maximum average temperature in the UAE 2013- 2021

Annual maximum average temperature in the UAE 2013- 2021
Annual maximum average temperature in the United Arab Emirates from 2013 to 2021 (in degrees Celsius)
-
Premium Statistic
Annual average number of rainy days in the UAE 2013-2020

Annual average number of rainy days in the UAE 2013-2020
Average number of rainy days in the United Arab Emirates from 2013 to 2020
-
Premium Statistic
Annual precipitation volume of the UAE 2008-2019

Annual precipitation volume of the UAE 2008-2019
Annual volume of precipitation in the United Arab Emirates from 2008 to 2019 (in million cubic meters)
-
Premium Statistic
Abu Dhabi's number of rainy days in in the UAE 2005-2020

Abu Dhabi's number of rainy days in in the UAE 2005-2020
Number of rainy days in Abu Dhabi in the United Arab Emirates from 2005 to 2020
-
Premium Statistic
Al-Ain's number of rainy days in the UAE 2005-2020

Al-Ain's number of rainy days in the UAE 2005-2020
Number of rainy days in Al-Ain in the United Arab Emirates from 2005 to 2020
-
Premium Statistic
Dubai's number of rainy days in the UAE 2005-2020

Dubai's number of rainy days in the UAE 2005-2020
Number of rainy days in Dubai in the United Arab Emirates from 2005 to 2020
-
Premium Statistic
Sharjah's number of rainy days in the UAE 2005-2020

Sharjah's number of rainy days in the UAE 2005-2020
Number of rainy days in Sharjah in the United Arab Emirates from 2005 to 2020
-
Premium Statistic
Ajman's number of rainy days in the UAE 2013-2020

Ajman's number of rainy days in the UAE 2013-2020
Number of rainy days in Ajman in the United Arab Emirates from 2013 to 2020
-
Premium Statistic
Umm Al-Quwain's number of rainy days in the UAE 2005-2020

Umm Al-Quwain's number of rainy days in the UAE 2005-2020
Number of rainy days in Umm Al-Quwain in the United Arab Emirates from 2005 to 2020
-
Premium Statistic
Ras Al-Khaimah's number of rainy days in the UAE 2005-2020
Ras Al-Khaimah's number of rainy days in the UAE 2005-2020
Number of rainy days in Ras Al-Khaimah in the United Arab Emirates from 2005 to 2020
-
Premium Statistic
Fujairah's number of rainy days in the UAE 2005-2020

Fujairah's number of rainy days in the UAE 2005-2020
Number of rainy days in Fujairah in the United Arab Emirates from 2005 to 2020
Kuwait
7
- Premium Statistic Annual rainfall in Kuwait 2005-2021
- Premium Statistic Annual average temperature in Kuwait 2012-2020
- Premium Statistic Maximum annual mean temperature in Kuwait 2005-2021
- Premium Statistic Minimum annual mean temperature in Kuwait 2005-2021
- Premium Statistic Rainfall days in Kuwait 2005-2021
- Premium Statistic Average amount of sunshine per day in Kuwait 2012-2021
- Premium Statistic Sandstorm days in Kuwait 2012-2019
Kuwait
-
Premium Statistic
Annual rainfall in Kuwait 2005-2021

Annual rainfall in Kuwait 2005-2021
Annual rainfall in Kuwait from 2005 to 2021 (in millimeters)
-
Premium Statistic
Annual average temperature in Kuwait 2012-2020

Annual average temperature in Kuwait 2012-2020
Annual average temperature in Kuwait from 2012 to 2020 (in degrees Celsius)
-
Premium Statistic
Maximum annual mean temperature in Kuwait 2005-2021

Maximum annual mean temperature in Kuwait 2005-2021
Annual average maximum temperature in Kuwait from 2005 to 2021 (in degrees Celsius)
-
Premium Statistic
Minimum annual mean temperature in Kuwait 2005-2021

Minimum annual mean temperature in Kuwait 2005-2021
Annual average minimum temperature in Kuwait from 2005 to 2021 (in degrees Celsius)
-
Premium Statistic
Rainfall days in Kuwait 2005-2021

Rainfall days in Kuwait 2005-2021
Annual number of rainfall days in Kuwait from 2005 to 2021*
-
Premium Statistic
Average amount of sunshine per day in Kuwait 2012-2021

Average amount of sunshine per day in Kuwait 2012-2021
Mean daily amount of sunshine in Kuwait from 2012 to 2021 (in minutes)
-
Premium Statistic
Sandstorm days in Kuwait 2012-2019

Sandstorm days in Kuwait 2012-2019
Annual number of sandstorm days in Kuwait from 2012 to 2019
Further reports
Get the best reports to understand your industry


Contact
Get in touch with us. We are happy to help.


Meredith Alda
Sales Manager– Contact (United States)
Mon - Fri, 9am - 6pm (EST)
Yolanda Mega
Operations Manager– Contact (Asia)
Mon - Fri, 9am - 5pm (SGT)
Kisara Mizuno
Senior Business Development Manager– Contact (Asia)
Mon - Fri, 10:00am - 6:00pm (JST)
Lodovica Biagi
Director of Operations– Contact (Europe)
Mon - Fri, 9:30am - 5pm (GMT)
Carolina Dulin
Group Director - LATAM– Contact (Latin America)
Mon - Fri, 9am - 6pm (EST)