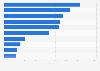
Industry revenue of “manufacture of basic pharmaceutical products“ in the Netherlands 2012-2025
This statistic shows the revenue of the industry “manufacture of basic pharmaceutical products and pharmaceutical preparations“ in the Netherlands by segment from 2012 to 2018, with a forecast to 2025. It is projected that the revenue of manufacture of basic pharmaceutical products and pharmaceutical preparations in the Netherlands will amount to approximately 260.38 million U.S. Dollars by 2025.